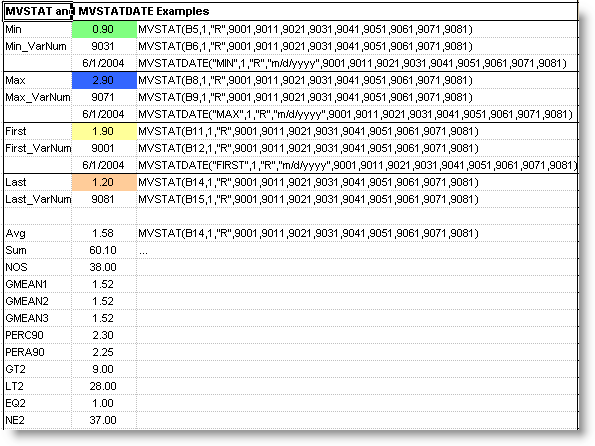
MVSTAT returns the specified summary statistic for a list of variables. Variables can be of different types (IE Calculated, Daily, Hourly,etc...).
SYNTAX:
MVSTAT("Stat",Offset,Grouping, VarNum1, VarNum2,…VarNum99)
or
MVSTAT("Stat",Offset,Grouping, "Where Clause")
or
MVSTAT("STAT", Offset, Grouping, Cell Ref)
Stat: The statistic in quotes (ie "AVG") of the value to calculate.
| Stat |
Notes |
| Avg |
Average of values |
| Sum |
Total of values |
| Max |
Maximum value |
| Max_VarNum |
Returns the Variable Number of the variable that has the maximum value. |
| Min |
Minimum value |
| Min_VarNum |
Returns the Variable Number of the variable that has the minimum value. |
| First |
First value found by date |
| First_VarNum |
The variable number of the variable that is the first value found. |
| Last |
Last value found by date |
| Last_VarNum |
The variable number of the variable that is the last value found. |
| GMean1 |
Returns the Geometric Mean of the values (convert 0 (zeros) to 1) |
| GMean2 |
Returns the Geometric Mean of the values (Add one to all if zero found) |
| GMean3 |
Returns the Geometric Mean of the values (Ignore zeros) |
| NOS,Count |
Retruns the count or number of values found |
| PERCxx |
Returns the value at the xx Percentile (i.e. PERC90). (Rounds up to the next value if exact match not found, ie 16 results, 16 * .9 = 14.4, rounded up is 15 so the 15th result in the sorted list will be returned) |
| PERAxx |
Returns the value at the xx Percentile (averages two closest values if exact match not found) |
| PERIxx |
Returns the value at the xx Percentile (interpolates two closest values if exact match not found). NOTE: This is the technique the Excel Percentile function uses. |
| PERExx |
Returns the value at the xx Percentile (interpolates two closest values, excludes first and last value). NOTE: This is the technique the Excel PERCENTILE.EXC function uses. |
| PERJxx |
Returns the value at the xx Percentile (interpolates two closest values if exact match not found). NOTE: Specified by Connecticut DPH and is slightly different Interpolation then PERI. Example to calc the 90th percentile of 7 samples:
7 * 90/100 = 6.3
Find the difference between the 6th (1.73) and 7th (1.95) ranked values:
1.95 - 1.73 = 0.22
Multiple .3 (the fractional part of the 6.3 above) times the difference:
0.3 * .22 = 0.066
Add 0.066 to the 6th ranked result:
1.73 + 0.066 = 1.796 |
| GTx |
Returns the number of values greater than x (i.e. GT30). |
| LTx |
Returns the number of values less than x. |
| EQx |
Returns the number of values equal to x |
| NEx |
Returns the number of values not equal to x. |
| LVGTLimitName |
Count of Last Values Greater Than the Limit Value specified by Limit Name from Regulatory Limits Setup, Variable Setup. |
| LVGTx |
Count of Last Value Greater Than x. |
| LVLTLimitName |
Count of Last Values Less Than the Limit Value specified by Limit Name from Regulatory Limits Setup, Variable Setup. |
| LVLTx |
Count of Last Value Less Than x. |
GroupOffset/StartDate: Used with the Grouping parameter to set the dates to calculate the stat for. Sets the number of Groups (set by the Grouping Parameter) to be added to set the dates. See examples below. If this field is a date string (i.e. "07/16/2004") or refers to a cell with a date in it, it is assumed to be the start date to calculate the stat for.
Grouping/EndDate: Used to set which dates to calculate the stat for. If the Grouping is a date literal string (i.e. "07/16/2004") or refers to a cell with a date in it, it is assumed to be the end date to calculate the stat for. Common Groupings are:
"D" Days
“M” Monthly
"R" Report Dates
Click here for availiable Grouping options
VarNum1..VarNum99: A comma separated list of variables that sets which variables to calculate from.
Where clause Instead of providing a list of variables, you can use an SQL Where clause against the VarDesc and Location table to get the list of variables. I.E. “Units = 'mg/L'” wound return all variables with Units set to mg/L. See Variable WHERE Clause.
NOTES:
To Locate this formula when designing a report, use Locate, Multivariable Group Summary.
SEE ALSO:
MVSTATDATE, MVSTATZ
EXAMPLES:
MVSTAT("MIN",1,"M",4011,4041) Returns the single, minimum value for the current month for variables 4011 and 4041
MVSTAT("AVG",1,"R",C5) Returns the average for the comma separated variable numbers listed in cell C5. If C5 contains the string "41,42,51,52" would return the average of those variable numbers. NOTE: This technique can be used to specify more the 99 variable numbers. See Join to create a comma separated list of variable numbers from cells or use a Pick VarNums Dashboard button.
MVSTAT("AVG",1,"R",C5) Returns the average for the where clause in cell C5. If C5 contains "VARNUM >4000 and NAME Like '%BOD'" would return the average for all variables greater than 4000 with a variable Name that ends in BOD.
MVSTAT("LVGTDMAX",1,"R","LOCATION.LVL1_ID=10 and NAME LIKE '%Free Chlorine'") Returns the count of all variables within the location id 10 (ie Distribution) with a variable name the ends with Free Chlorine that's last value in the date range is greater than each variable's Daily Max (DMAX) Limit.
MVSTAT("MAX",1,"M","UNITS = 'mg/L'") Returns the single, maximum value for the current month for all variables that have mg/L as units.

Download Example Template: Help_MVStat.ss3 (Click here for download instructions)