Variable: Sets the variable to summarize
Stat: Sets the summary statistic to use. Choose one from the following on the dropdown list:
|
Minimum |
Finds the minimum value |
|
Maximum |
Finds the maximum value |
|
Total |
Sum of all values found |
|
Average |
Sum all values and divide by the number of values found |
|
Avg Over Time |
Sum all values found, then divide by the number of data slots in the date range |
|
Avg Median |
Calculates the Average or Median according to the California Average Median Rules. |
|
Geo Mean (Ignore 0) |
Calculate the Geometric Mean ignoring Zeros |
|
Geo Mean (Convert 0 to 1) |
Zeros are converted to one (1) before geometric mean is calculated. |
|
Geo Mean (Add One to All) |
If any value is zero (0), one is added to each value in the set and then one is subtracted from the result. |
|
# of Daily Violations |
Counts the number of times the daily value is above the daily max limit or below the daily min limit. |
|
Geo Mean (Median) |
Calculates the Geometric Mean or Median according to the California Average Median Rules. See GGMMEDZ function. |
|
# Samples |
Counts the number of samples |
|
Median |
The median is the number in the middle of a set of numbers; that is, half the numbers have values that are greater than the median, and half have values that are less. |
|
Standard Deviation |
Calculates the standard deviation for the variable |
|
Range |
The difference between the max and min value |
|
First |
Finds the first value that exists in the date range for the variable |
|
Last |
Finds the last value that exists in the date range for the variable |
|
Average Difference |
Returns the average of the differences (i.e. the value minus the last value found) for all values in the date range. The difference is calculated based on the difference type setting (see below). |
|
Maximum Difference |
Returns the maximum of the differences (i.e. the value minus the last value found) for all values in the date range. The difference is calculated based on the difference type setting (see below). |
|
Minimum Difference |
Returns the minimum of the differences (i.e. the value minus the last value found) for all values in the date range. The difference is calculated based on the difference type setting (see below). |
|
Total Difference |
Returns the total of the differences (i.e. the value minus the last value found) for all values in the date range. The difference is calculated based on the difference type setting (see below). |
|
Conditional Count |
Returns the count of values that meet the condition specified by Condition and Limit. |
Locate Statistic for: Sets the number of values to place and the grouping of the data. For example, to summarize a column of daily values for one month, enter 1, or, to place a statistic for 12 consecutive months, enter 12. The drop down list sets the grouping parameter in the Group function (ie GAVG, GMAX).
|
Hours |
Group Data by hours (typically used to summarize 15 minute, 1 minute,etc... date) |
"H" |
|
Partial Days |
Group data by certain hours of the day (i.e. 8AM thru 5PM). When this option is selected you will be prompted to set the Start Time and Stop Time for the grouping. |
"Hx:x" |
|
Days |
Group data by days (typically used to summarize data from hourly, 15 Minute, 1 minute, etc... data) |
"D" |
|
Months |
Group data by months |
"M" |
|
Quarters |
Group data by entire quarter |
"Q" |
|
Semi-Annuals |
Group data by Jan - June and July - Dec. |
"SA" |
|
Seasons |
Group data by Winter, Spring, Summer, Fall
|
"S" |
|
Years |
Group data by Calendar years
|
"Y" |
|
Year to End Date |
Group data from start of year through the end date of the report |
"YTD" |
|
Year to Start Date |
Group data from start of the year though one day before the start date of the report
|
"YTBSD" |
|
Moving 12 Month |
Group data by 11 months prior to the Start Date through the end of the month of the start date.
|
"MAxx" |
|
Moving N Day |
Group data by N number of days. You will be prompted for the number of days. |
"MOVx" |
|
Report Dates |
Group data from Start Date of report through the End Date of the Report. |
"R" |
|
All (1970 - Now) |
Calculate Statistic for all data (1970 through the current date) |
"A" |
Place < or > Symbol with statistic: If the variables allow entry of data qualifiers (i.e. <, >, or ND) do you want the symbol to be placed with the calculated statistic. If checked and a statistic that does not find a particular value (i.e. Max, Min, First... find a value, Avg, GeoMean, Total do not) is chosen the following options will be given:
"if one value contains a < or >"
"if all values contain a < or >"
"if half the values are < or >"
"cascade all symbols"
Decimal Places: The number of digits to show behind the decimal point. This value will default to the number of decimal places defined in the description of the variable selected. See Also: Formatting with 'Not Fixed'
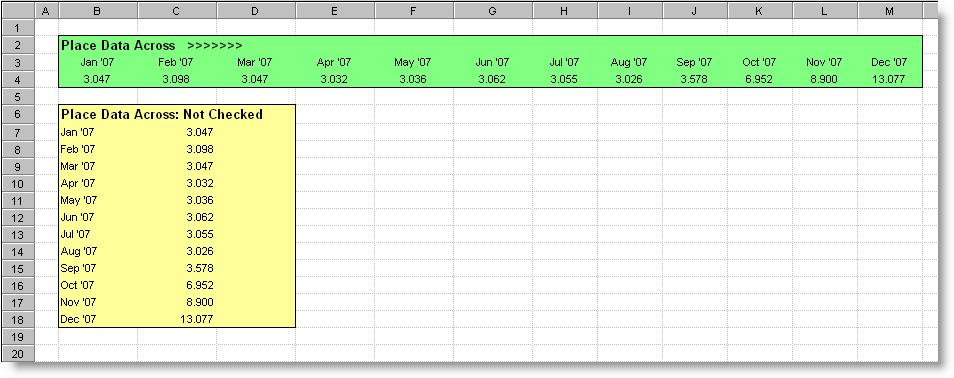
Place Data Across: When placing data into the report, locate across columns instead of down rows.
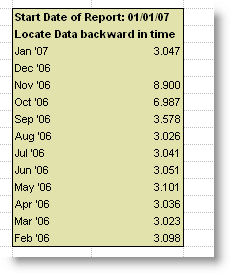
Locate data backward in time: If checked, data will be placed for previous time periods instead of next time periods. For example, if you are locating 12 monthly averages and you want the current month and the previous 11 months you would check this box.
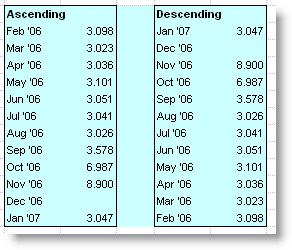
Order by Date: Locate data Ascending by date or descending
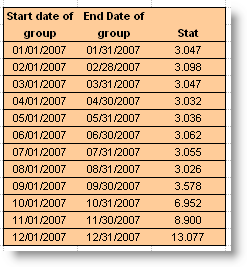
Place Start Date of Group: If checked, places the start date of each group beside the data.
Place End Date of Group: If checked, places the end date of each group beside the data.
Print ______ if no data found: Can only be used if placing data with the Place <,>, or ND Symbol with statistic option checked. Will print the specified string (no data, no samples...) if no values for the group are found.
Print the "Optional Print Value" if the Threshold Valve is crossed: If checked, the optional print value from system setup will be printed instead of the actual value when the threshold is crossed.
Download Example Template: Help_Place_Data_Across.ss3 (Click here for download instructions)