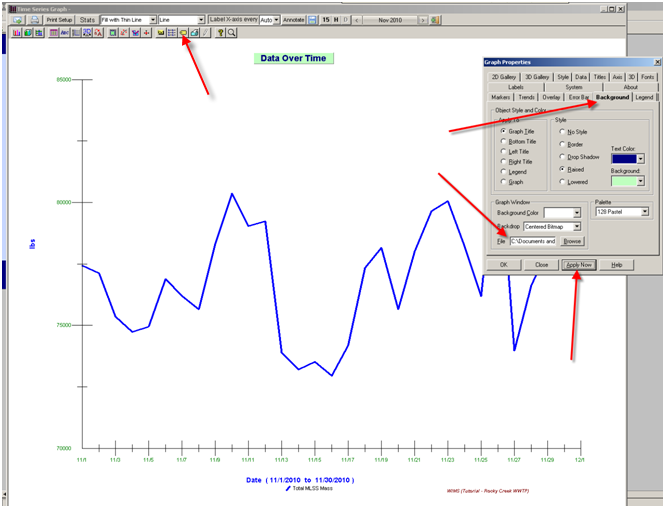
When viewing a graph (Time Series, Correlation, etc...) and adding a bitmap as a background (backdrop) to the graph the graphic does not display. The problem is that the WIMS graph package can only display bitmaps with 8 bit depth (color depth), AKA 256 Color Bitmap. No message is displayed when a 24/16 bit graphic is chosen, it simply does not display.

WORKAROUND:
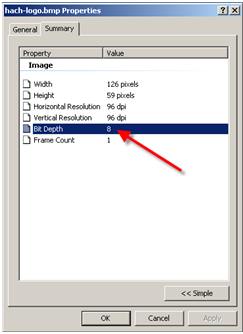
Convert the graphic to 8 bit depth. To find the bit depth of a file, simply right click on the file in Windows Explorer, go to properties, and click on the Summary Tab:

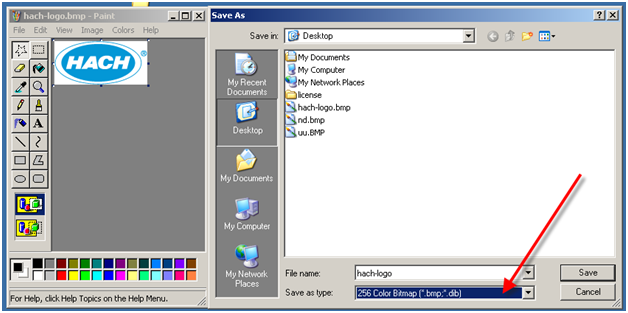
Open up the graphic in MS Paint and Save As. You can then change the file to an 8 bit depth by changing the save as type to 256 Color Bitmap

New file properties shows 8 bit depth.

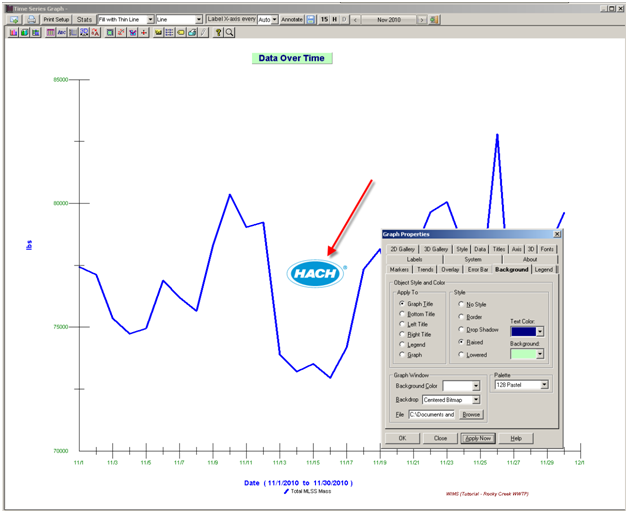
You will now be able to display the graphic as a backdrop:
