What's New in Hach WIMS 7.5.
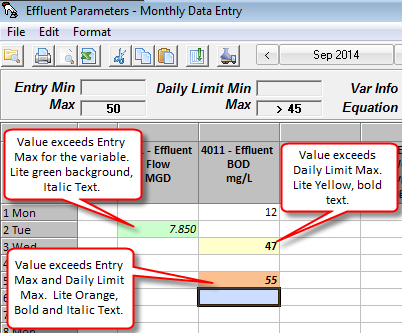
1. Entry Limit Exceedances and Daily Limit Violations are now highlighted with background colors in all data entry forms making identification easier.
2. Multi-Facility Query form added. Multi Facility Query allows data to be retrieved from multiple facility databases. Data can be viewed on the screen, copied to the clipboard, or exported to Excel. Use the GlobalIDs to identify variables in a standard way to make querying easier.
Example: Show me all regulatory results for all facilities in New Mexico.
Step 1: Setup Global IDs for variables
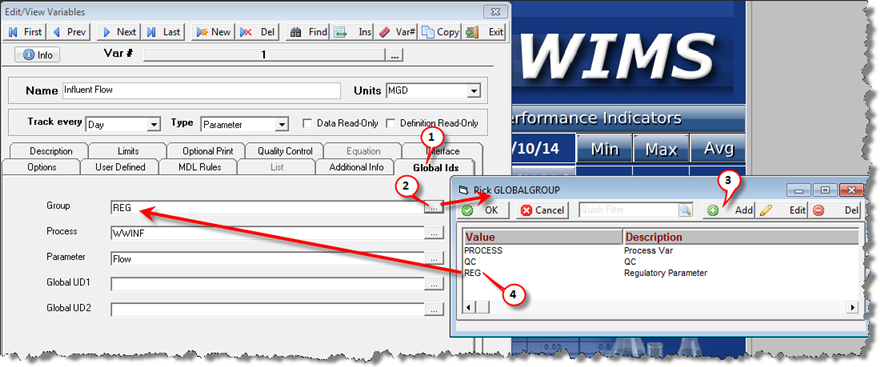
| 1 |
Click on Global Ids tab. |
| 2 |
Click on the list of values button to pick a valid value for Group. |
| 3 |
Add Values into the global list, e.g. all facilities will use this list. |
| 4 |
Pick the value, "REG" in this example |
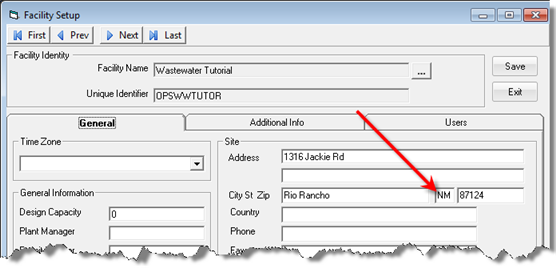
Step 2: Enter state in Facility Setup
Step 3: Go to Utilities>Multi Facility Query (Super Users Only!)
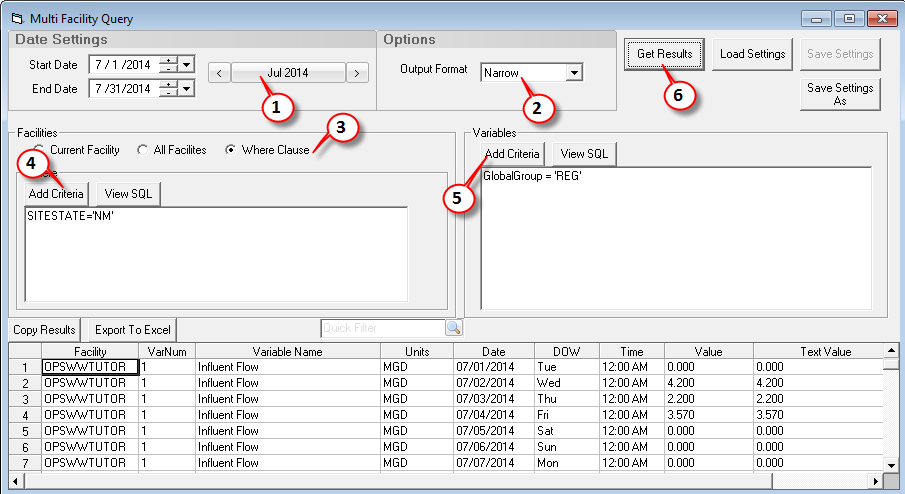
| 1 |
Set the Date Range |
| 2 |
Set the Output Format to Narrow. (see examples below of the different output formats) |
| 3 |
Choose the Facilities Where Clause Option |
| 4 |
Click Add Criteria, choose Field SITESTATE, operator "=", and value to NM and click OK. This will build the WHERE clause that will query the OPSROOT.FACILITY and FACILITY_I Table. |
| 5 |
Click Add Criteria in the Variables section. Choose GlobalGroup, operator "=", and value of 'REG'. Note: See Variable Edit, Global Ids for information on setting up the Variable Global fields. |
| 6 |
Click Get Results. |
3. New Variable Analysis Charts. Go to Graph Pac, Variable Analysis Graphs
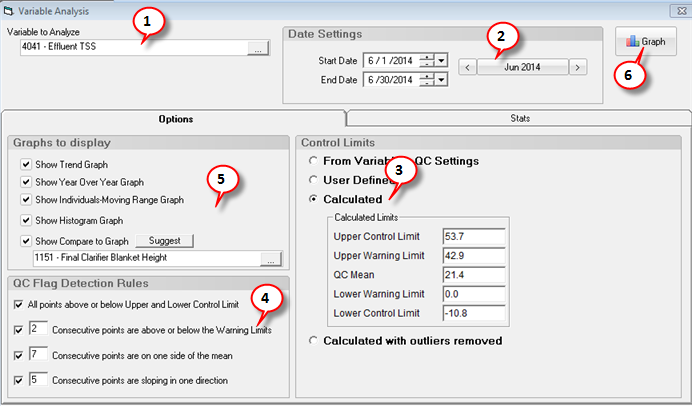
1. Use the Variable Picker to set the Variable to Analyze.
2. Set the date range for the graphs and analysis. Stats will automatically be calculated and displayed on the Stats tab. Calculated and Calculated with outliers removed Control Limits will be refreshed.
3. Choose which Control Limits to use. The Trend, I-MR Graph, and Histogram graph will display the Control limits and allow you to test for QC Flags. See Calculating Control limits.
- From Variable's QC Settings. The Quality Control Limits set on the Quality Control Tab in Edit/View Variables will be read in.
- User Defined. Enter your own UCL, UWL, QC Mean, LWL, and LCL.
- Calculated. The control limits are calculated based on the variable and date range selected.
- Calculated with outliers removed. The control limits are calculated based on the variable, date range selected. However, outliers are removed from the data set based on the Outlier Detection Selection on the Stats tab. See Outlier Detection for details on detection methods.
4. Set your QC Flag Detection Rules. These settings are used to analyze the graphs and flag QC or SPC "Special Causes".
5. Pick the graphs to be displayed:
6. Click 
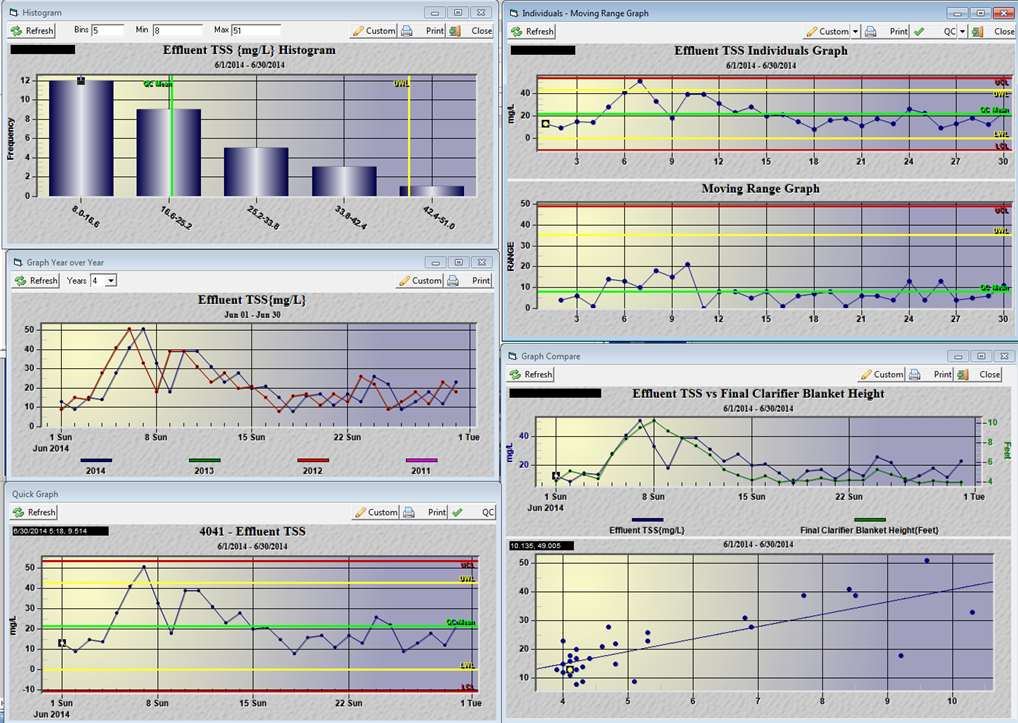
4. Suggest button added to Correlation Graph and Variable Analysis Graph. Displays correlation calculations (AKA heat map) to determine which variables correlate to the chosen variable.
Example: Find variables that correlate to Effluent BOD.
1. Go to Graph Pac, Variable Analysis Graphs
2. Choose Effluent BOD as the Variable to Analyze.
3. Click the  button. This will display the Correlation Calculations for Effluent BOD:
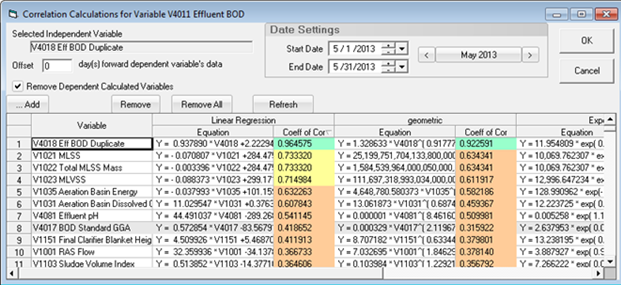
In this example, we find that the Eff BOD Duplicate correlates to Eff BOD the best. However, while this makes perfect sense statistically, this give us no insight into what affects our Eff BOD. However, MLSS is second on the list and something we can control.
See WIMS Client Release Notes for a list of bug fixes and enhancements