|
Spread Report Design eDMR/eReport used to locate data for filling out the California CIWQS form electronically.
NOTE: Please see CIWQS EZ for an alternative (typically easier) method to creating the report. |
 |
OVERVIEW:
This form is used to "map" your state provided PET Tool Excel File to produce a file that can be uploaded to the state. Basic Steps:
- Get your PET Tool Excel file from the state for mapping
- Update your variables and locations to make Auto Detection of variables easier. See California CIWQS Auto Detection rules.
- Decide how data qualifiers, MDL's and RL/ML are handled. See Rules for displaying results and planning CIWQS reporting.
- Get into Spread Design, download the CA_CIWQS.hwr template from here. Use File, New and load CA_CIWQS template.
- Fill out the header info (Discharger Name, Facility Name, etc...) starting in cell C2
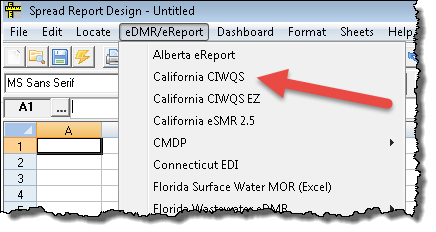
- Choose Locate, EDMR / Electronic Report Link, California CIWQS.
- Click Load and browse to your PET Tool Excel File to load the file for mapping.
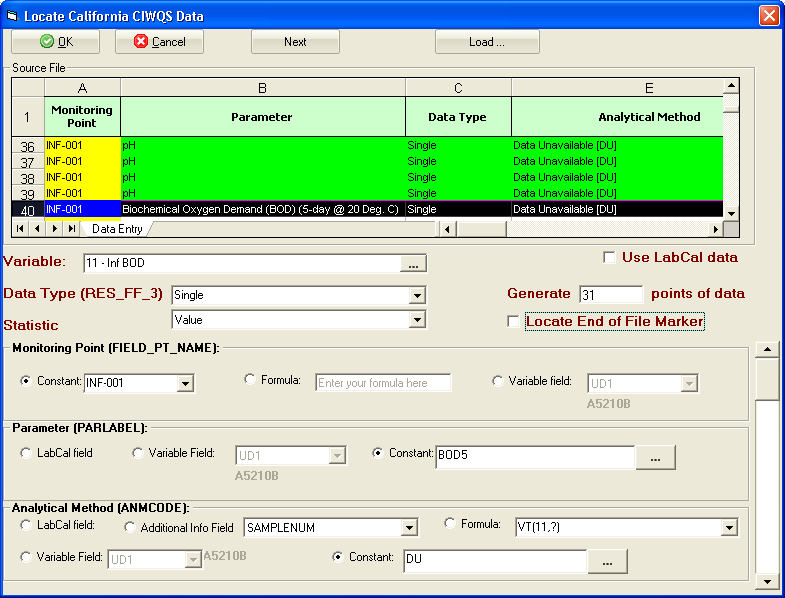
- Click on a row in the Source File to map, check defaulted selections and click OK.
- Repeat Step 6 until the entire PET Tool has been mapped.
- Use Report Pac, Spread Reports and choose the eDMR / Electronic Report File option to create your report.
BUTTONS:
 |
Locate the appropriate data into the spread report being edited |
 |
Cancel the location and exit the CA CIWQS window without editing the spread report |
 |
Moves to the Next Parameter in the Source File. Skips duplicate rows. WIMS will default the fields for you based on the row selected. It will auto detect the variable, Data Type, Monitoring Point etc... |
 |
Used to load your PET Tool Excel file into the source file window to allow quick mapping of the data. |
FIELDS:
Variable: Sets the variable to locate. Will be auto detected when a row is selected from the loaded Source file. See Auto Detection of variable below for rules. Use the  button to open the variable browser to select a variable.
Data Type (RES_FF_3): Sets what is to be located as read from the loaded Source file (PET Tool xls file).
Statistic: Sets the summary statistic to use or Single for Raw values. Choose one from the following on the dropdown list:
Use Lab Cal Data: If checked, the Analytical Method, ParLabel, Basis, and Sampid will be pulled from the Lab Cal Sample for the variable. Will be disabled if you do not have the Lab Cal Add-On.
Generate __ points of data: Sets the number of values to locate. If locating single values, should be set to 31, locating a monthly summary should be set to 1, and a Weekly Summary set to 5. This field will be defaulted based on the Data Type (RES_FF_3) field.
Locate End of File Marker: In order to write the last record to the CDF file, an End of File marker must be placed. The checkbox will be automatically checked if you have loaded your PET Tool XLS file and are on the last row (record) in the file. If checked, will locate "End of File" text with an OEML instruction (cell note) after the last column located.
Monitoring Point (Field_PT_Name): Sets how the Monitoring Point will be populated. You have the following options:
|

|
Default. Sets the Monitoring Point to the text selected (INF-001).
|
|

|
Enter a Spread Report Formula to set the Monitoring Point. Example VINFO(1,"LOCATION.UD9") will pull the monitoring point from the Variable 1's Location UD9 field |
|

|
Sets the Monitoring Point from the selected variables User Defined (UD) field. The text in bold displays the value for the currently selected variable/UD field. For Example, variable 1's UD1 field is set to RGRAB:FLOW. |
Parameter (PARLABEL): Sets how the Parameter will be populated. You have the following options:
|

|
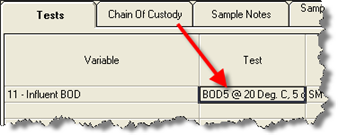
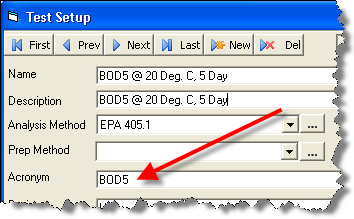
Uses the TEST.TESTACRONYM field based on the Lab Cal test for the sample variable.
|
|

|
Sets the Parameter from the selected variables User Defined (UD) field. The text in bold displays the value for the currently selected variable/UD field. For Example, variable 1's UD1 field is set to RGRAB:FLOW.
|
|

|
Sets the Parameter as the text specified. Text will be defaulted to the PET Tool Text, using the Parameter field to query the LC_TESTLIB table (system lookup table in WIMS) for the TestAcronym. Use  to browse a list of common values. to browse a list of common values. |
Analytical Method (ANMCODE): Sets how the Analytical Method will be populated. You have the following options:
|

|
Uses the METHOD.METHODACRONYM field based on the Lab Cal Method for the sample variable.

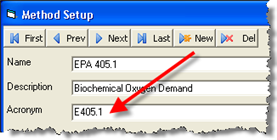
|
|
|
|

|
Enter a Spread Report Formula to set the Analytical Method. Examples:
VINFO(1,"UD4") will pull the text from Variable 1's UD4 field.
AINFO(11,?,"METHOD") would return the Additional Info Method field for variable 11. The "?" is replaced with a reference to the sample date for each Column (data point) located.
VT(13,?) would return the text value entered into Variable 13 for the date. I.E. the method is hand entered into variable 13.
|
 |
Will retrieve the Analytical Method from the Data Additional Info field specfied using the AINFO formula. If disabled, no Data Additional Info fields have been setup. |
 |
Sets the ANMCODE from the selected variable's User Defined (UD) field. The text in bold displays the value for the currently selected variable/UD field. For Example, variable 11's UD1 field is set to A5210B. |
|

|
Sets the Analytical Method as the text specified. Text will be defaulted to the PET Tool Text, Analytical Method value within the square brackets []. Use  to browse a list of common values. to browse a list of common values. |
Basis: Sets how the Basis will be populated. The Basis is used to further specify the Parameter being measured. It can have the following values.
L - Dissolved (i.e. Arsenic, Dissolved)
N - Total Recoverable
U - Percent Removal
"" - Blank, which means no Basis needs to be specified. Many of the Parameter Codes listed in the PET Tool Excel file do NOT have a basis, therefore they can be left blank.
You have the following options to populate the Basis:
|

|
Uses the TEST.TESTBASIS field based on the Lab Cal test for the sample variable.
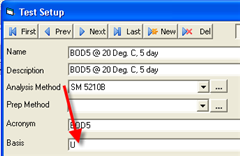
|
|

|
Sets the Basis from the selected variables User Defined (UD) field.
|
 |
Sets the Basis as the text specified. Will be defaulted from the PET Tool Parameter field |
 |
Will be set if the Parameter (PARLABEL) constant option is selected using the  button. button. |
Matrix: Should ALWAYS be defaulted to "W".
PVCCODE: Should always be defaulted to "PR".
LOGCODE: Should always be defaulted to "N/A".
MDL (LABDL): Sets the MDL (Method Detection Limit) value. NOTE: ONLY applies to results entered with a "DNQ" qualifer or a result of "ND" (i.e. ND with no number after it). If the result is NDx, NMx, or < the MDL will be set to the x. For example, if the result is ND2 the MDL will be set to 2 (<0.5 would be 0.5, and NM4 would be 4). However, this field will be used if a DNQx is entered as the x represents the numeric result, not the MDL. You have the following options to populate the MDL:
|

|
Sets the MDL to the constant specified. |
|

|
Enter a Spread Report Formula to set the MDL. Examples:
VSAMP(11,?,"TEST.MDL") will pull the MDL from the Lab Cal Test MDL field.
VINFO(1,"UD4") will pull the text from Variable 1's UD4 field.
AINFO(11,?,"MDL") would return the Additional Info MDL field for variable 11. The "?" is replaced with a reference to the sample date for each Column (data point) located.
VT(13,?) would return the text value entered into Variable 13 for the date. I.E. the method is hand entered into variable 13. |
 |
Will retrieve the MDL from the Data Additional Info field specfied using the AINFO formula. If disabled, no Data Additional Info fields have been setup. |
 |
The MDL will be pulled from the specified variable using the VT function. Use the  button to pick the variable. button to pick the variable. |
ML (REPDL): The Minimum Level (or Reporting limit) for the method. This will only be reported with DNQ results. You have the following options to populate the ML:
|

|
Sets the ML to the constant specified. |
|

|
Enter a Spread Report Formula to set the MDL. Examples:
VSAMP(11,?,"TEST.RL") will pull the RL from the Lab Cal Test MDL field.
VINFO(1,"UD4") will pull the text from Variable 1's UD4 field.
AINFO(11,?,"ML") would return the Additional Info MDL field for variable 11. The "?" is replaced with a reference to the sample date for each Column (data point) located.
VT(13,?) would return the text value entered into Variable 13 for the date. I.E. the method is hand entered into variable 13. |
 |
Will retrieve the MDL from the Data Additional Info field specfied using the AINFO formula. If disabled, no Data Additional Info fields have been setup. |
 |
The MDL will be pulled from the specified variable using the VT function. Use the  button to pick the variable. button to pick the variable. |
SAMPID: The Sample ID for the result. If you do not track Sample IDs, choose the Constant N/A. If LabCal Field is selected, it will display the LabCal Sample Number for the result.
UNITS:
Sets the Units field. This field MUST be from the list of acceptable Units provided by the state, so it is strongly recommended to use the selected Constant value.
Analysis Date (ANADATE): The date the analysis is started (per Mike Fischer, Central Valley Regional Water Quality Control Board call CIWQS Help center, 1-866-79-CIWQS for more information). For calculated summaries (i.e. Data Types of Average Monthly (AMEL), 7 day median, etc...) the end date of the summary will be displayed for the Analysis Date. For example, a Average Monthly (AMEL) type will calculate the monthly average for the variable and locate the last day of the month for the Analysis Date. For Data Type's where a raw result is reported (i.e. Single) the following options are available:
|

|
Will use the Test's Analysis Start Date (LC_SAMPLETEST.DATESTART). |
 |
Will use the Test's Analysis Date Complete (LC_SAMPLETEST.DATECOMPLETE). Note: It is recommended that the Analysis Start Date is used, however your regional board may require the date complete. If you are not sure contact your regional board or the CIWQS help center. |
 |
Will add the number of days specified to the Collection/Sample Date. Enter 0 if you analyze on the same day you take the sample. Uses the DATEADD function. |
|

|
Enter a Spread Report Formula to set the Analysis Date. Examples:
VSAMP(11,?,"ANALYSIS_END") will pull the Analysis date from the Lab Cal Test Analysis Date Complate field.
DATEADD("D",1,?,"mm/dd/yyyy")
VT(13,?) would return the text value entered into Variable 13 for the date. I.E. the analysis end date is hand entered into variable 13. |
 |
Will retrieve the Analysis date from the Data Additional Info field specfied using the AINFO formula. If disabled, no Data Additional Info fields have been setup. |
 |
The Analysis Date will be pulled from the specified variable using the VT function. Use the  button to pick the variable. button to pick the variable. |
Collection Time (LOGTIME): Time Sample was collected. "For grab samples, use the time that you collect samples. For composite samples, use the beginning of the compositing period" - (from eSMR2 Business rules, see attached)
|

|
Will use the time (3:17 PM) from the Sample Date/Time (LC_SAMPLE.sampledttime)

|
 |
Will retrieve the Collection Time from the Data Additional Info field specfied using the AINFO formula. If disabled, no Data Additional Info fields have been setup. |
 |
Sets the Collection Time to the constant Specified. Enter in hh:mm (miltary time) format. |
|

|
Enter a Spread Report Formula to set the Collection Time. Examples:
VT(13,?) would return the text value entered into Variable 13 for the date. I.E. the analysis end date is hand entered into variable 13.
COM(?,15) would return the result comment for variable 15. The "?" is replaced with a reference to the sample date for each Column (data point) located. |
 |
The Collection Time will be pulled from the specified variable using the VT function. Use the  button to pick the variable. button to pick the variable. |
QA Code (RLNOTE): Optional. The QA Code (i.e. the 1 or 2 letter code) associated with the result. For example, if you are entering the QA Code into a result comment, you MUST enter "J". If you enter J - Estimated Value the PET Tool will reject the entry.
B Analyte present in the blank and the sample
BB Sample > 4x spike concentration
BS Insufficient sample available to follow standard QC procedures
EB Value is estimated
GB Matrix spike recovery not within control limits
GN Surrogate recovery is outside of control limits
HR Post digestion spike
IM Method does not include this analyte as part of compound list
J Estimated value
R Data rejected
U Compound was analyzed for, but was not detected
|

|
Field will be set to blank or no value. |
 |
Will retrieve the QA Code from the Data Additional Info field specfied using the AINFO formula. If disabled, no Data Additional Info fields have been setup. |
 |
The QA Code will be pulled from the specified variable using the VT function. Use the  button to pick the variable. button to pick the variable. |
REPDLVQ: This field is always located and displays "MRL" if the Qualifier is ND or DNQ. "(If ND or DNQ specified as Qualifier [PARVQ] populate field with the text “MRL” otherwise leave blank)" - from esmr2Bus_rules.pdf (attached)
RUN_NUMBER: This field is always located and display "1" if there is a result for the day. "(Used to count samples taken on the same day. “1” default)" NOTE: You may need to edit this field if you have more than one sample with the same Parameter, Sample Date, Sample Time, and Analysis Date, we believe in this case the 2nd result should have a 2 (i.e. a duplicate result that is reportable).
Rules for displaying results
The California CIWQS report has some unique requirements when reporting results with data qualifiers. You must understand these rules and setup your variables accordingly.
Definitions:
Minimum Level (ML, CIWQS REPDL field) represents the lowest quantifiable concentration in a sample based on the proper application of method-specific analytical procedures and the absence of matrix interferences.
Reporting limits (RL) used by a lab, may be from the method, derived spcifically for that lab, instrument or sample matrix; or as directed by a regulatory agency. In many cases is the same as the Minimum Level.
Method Detection Limit (MDL, CIWQS LABDL field) based on the ability of a measurement to detect an analyte in the absence of a matrix.

PET Tool screen shot shows what fields need to be entered (indicated by the ?) when certain data qualifiers are entered.
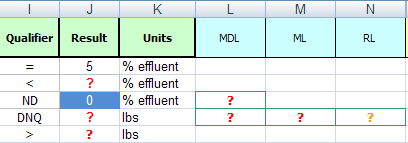
Rules: These rules are combined from several sources including the esmr2Bus_rules.pdf (attached), CIWQS Help Desk, and customer input:
Normal Result (i.e. above the RL or ML) - Set Qualifier to "=" and result to numeric result
< Result - Set Qualifer to "<" and set result to the MDL, user should enter <2 into WIMS where 2 is the MDL.
ND Result - Set Qualifer to ND, set result to "0" (zero), and set MDL. User should enter ND2 into WIMS where 2 is the MDL.
DNQ result - Set Qualifer to "DNQ", and set Result, MDL, and either the ML or RL. WIMS supports the ML (REPDL) field and will leave the RL field blank as you only need to fill in the ML or the RL. User should enter DNQ3 into WIMS where 3 represents the Result. The MDL and ML can be gotten from a number of places including Variable UD fields, located as constants, Additional info, etc...
Therefore, when entering results below the MDL should be entered as ND2 if 2 is your MDL. NOTE: Your ND symbol must be setup to allow numeric entries (see Symbol Setup).
Results between the MDL and the RL should be enter as DNQ3 if your test result (result) is 3. On the report, we will need to also report the MDL and ML when reporting DNQ results.
Results greater than the RL/ML can be reported as the result with a qualifer of "="
Therefore, depending on how data is entered the report needs the data qualifier, result, MDL, and the ML/RL. When locating data into the report, you set where to get the MDL and RL from. It can be a constant that you simply enter or it can look it up from a variable's User Defined field.