Home : Products : Hach WIMS : Hach WIMS Client : Documentation : Main Menu : Design : Spread Reports : Locate : Graph : Locate Saved Year over Year Graph
Q14778 - INFO: Locate Saved Year over Year Graph
 
Locates a saved Year Over Year Graph  or graphs into the report using the GRAPHYOY function.


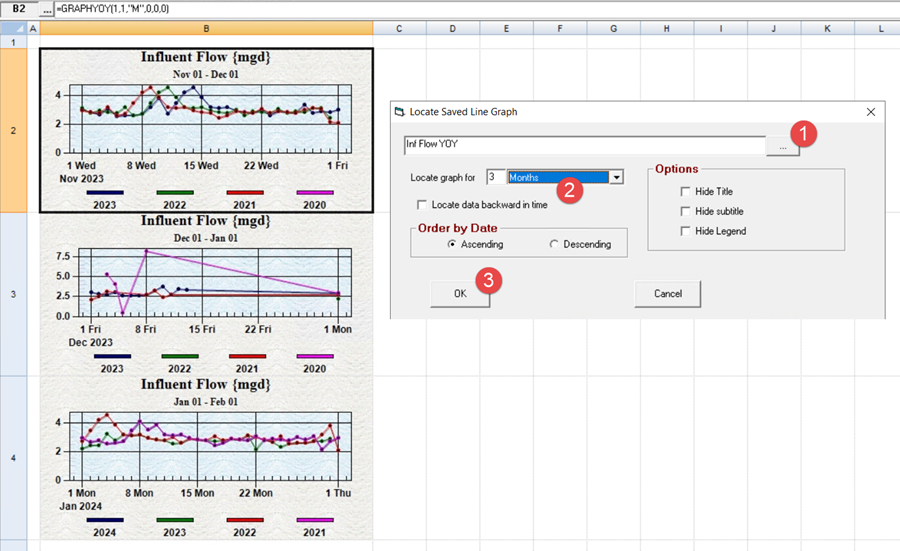
1. Use Locate, Graph, Saved Year Over Year Graph and click ... button to browse the saved Year Over Year Graphs

2. Set the number of graphs and their grouping. In this example we are locating 3 graphs each with data for a month.

3. Click OK and the 3 graphs will be located into the report using the GRAPHYOY function. 

NOTE:  It is best to size the cells to make room for the graph prior to locate.  If cells are merged, the locate will place a graph and move to the next unmerged row and place the next graph.

Options:

  • Hide Title - Hides the graph title ("Influent Flow {MGD}" in example above)
  • Hide SubTitle - Hides the date range below the title
  • Hide Legend - Hides the graph legend at the top of graph. 
Related Articles
No Related Articles Available.

Article Attachments
No Attachments Available.

Related External Links
No Related Links Available.
Help us improve this article...
What did you think of this article?

poor 
1
2
3
4
5
6
7
8
9
10

 excellent
Tell us why you rated the content this way. (optional)
 
Approved Comments...
No user comments available for this article.
Created on 2/22/2024 12:22 PM.
Last Modified on 2/22/2024 12:22 PM.
Last Modified by Scott Dorner.
Article has been viewed 258 times.
Rated 0 out of 10 based on 0 votes.
Print Article
Email Article