|
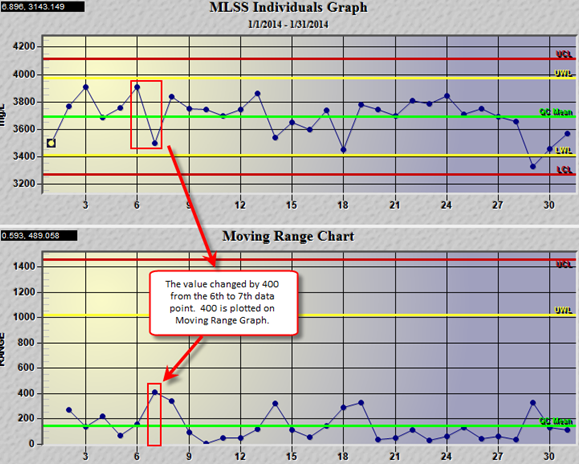
An individuals and moving range (I-MR) chart is a pair of control charts is used to determine if a process is stable and predictable. It creates a picture of how the system changes over time. The individual (I) chart displays individual measurements. The moving range (MR) chart shows variability between one data point and the next. Individuals and moving range charts are also used to monitor the effects of process improvement theories.
|
 |
An individuals and moving range (I-MR) chart is a pair of control charts is used to determine if a process is stable and predictable. It creates a picture of how the system changes over time. The individual (I) chart displays individual measurements. The moving range (MR) chart shows variability between one data point and the next. Individuals and moving range charts are also used to monitor the effects of process improvement theories.
To produce a I-MR Graph
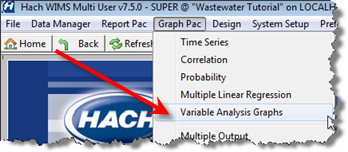
1. Go to Graph Pac, Variable Analysis Graphs.
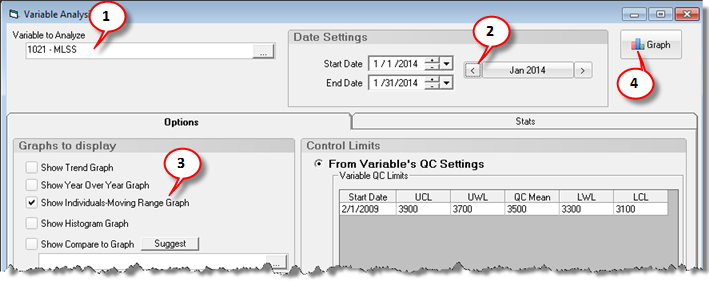
2. Choose your variable and date range. In this example, choose MLSS and Jan 2014.
3. Check the Show Individuals-Moving Range Graph. Click 


Intrepreting the I-MR Graph
The individuals graph is similar to the trend graph, the difference being is that it plots points one right after another regardless of the date of the value. For example, if you take a sample every Monday and Thursday the trend graph will show a point on Monday, a point on Thursday with a line between the points. An individuals graph would show Monday’s value as the 1st point in the graph, Thursday’s value would be the second point, etc…
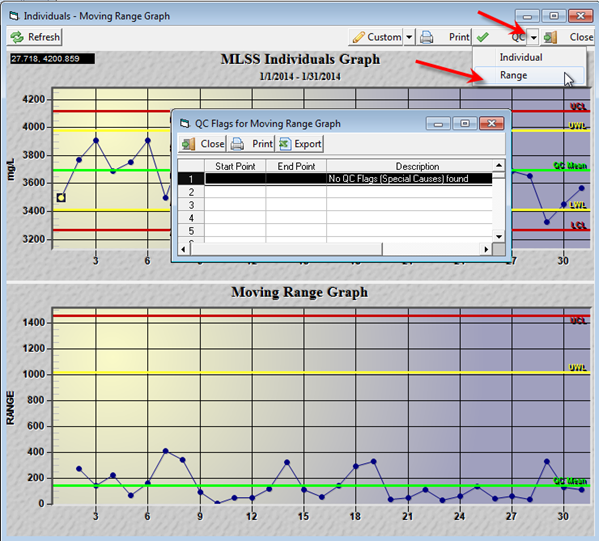
However, determining QC Flags is the same. Click the QC pull down and select Individuals:

To determine QC Flags for the Range Graph, click the QC pull down and select Range. A moving range will only have a UCL (Avg of data set + 3 Standard Deviations) and a UWL (Avg of data set + 2 Standard Deviations). Lower control limits do not make sense as we always want lower variance, and the range cannot be negative.
In this case there are no QC Flags (Special Causes).
