|
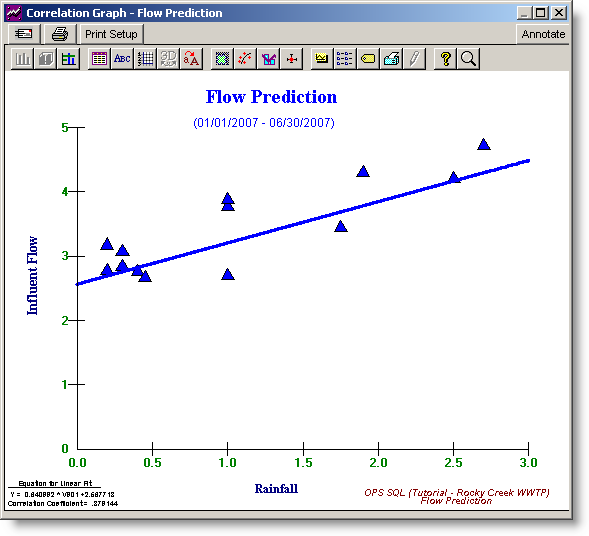
A Correlation graph is displayed in this window. The data set is defined on the Correlation Input form. |
 |
 |

USING:
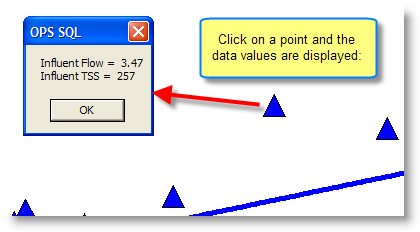
Correlation graphs are "Hot". This means that the user can click on a data point to display the actual data values for that point.

Each of the buttons in the row of buttons below those listed above (the buttons with icons instead of words) opens a specific page of the Graph Properties Pages which can be used to modify the appearance of the graph. Click here for more information on customizing the appearance of graphs.
BUTTONS:
 |
Outputs graph as a jpg and emails it to user specified email addresses. |
 |
Outputs graph to the current printer. |
 |
Allows selection and setup of the printer. |
 |
Prompts for text to be placed on the graph. Allows you to remark on certain data points. |
 |
Saves the currently displayed graph. All of the setup parameters and graph properties are saved. The next time the graph is loaded (by Load button on Correlation Input form), the selected data sets are refreshed from the database. A saved graph can also be used with Multi Graph Output.
|
 |
Exit the graph view window and returns to Correlation Input. |