Choose Variables By: Sets how to select the variables to summarize.
By Selection allows you to use the variable browser to pick the variables to summarize. Click  to display the variable browser to add variables to the list.
By Where Clause: Allows you to enter the Where portion of an SQL Select statement using the Vardesc table (FROM VARDESC) to select the variables. Examples: VarNum < 10, STORETCODE = '00310' OR STORETCODE = '80082', NAME LIKE '%TOTAL COLIFORM'
Stat: Sets the summary statistic to use. Choose one from the following on the dropdown list:
| Stat |
Notes |
| Avg |
Average of values |
| Sum |
Total of values |
| Max |
Maximum value |
| Max_VarNum |
Returns the Variable Number of the variable that has the maximum value. |
| Min |
Minimum value |
| Min_VarNum |
Returns the Variable Number of the variable that has the minimum value. |
| First |
First value found by date |
| First_VarNum |
The variable number of the variable that is the first value found. |
| Last |
Last value found by date |
| Last_VarNum |
The variable number of the variable that is the last value found. |
| GMean1 |
Returns the Geometric Mean of the values (convert 0 (zeros) to 1) |
| GMean2 |
Returns the Geometric Mean of the values (Add one to all if zero found) |
| GMean3 |
Returns the Geometric Mean of the values (Ignore zeros) |
| NOS,Count |
Retruns the count or number of values found |
| PERCxx |
Returns the value at the xx Percentile (i.e. PERC90). |
| PERAxx |
Returns the value at the xx Percentile (averages two closest values if exact match not found) |
| GTx |
Returns the number of values greater than x (i.e. GT30). |
| LTx |
Returns the number of values less than x. |
| EQx |
Returns the number of values equal to x |
| NEx |
Returns the number of values not equal to x. |
Locate Statistic for: Sets the number of values to place and the grouping of the data. For example, to summarize a column of daily values for one month, enter 1, or, to place a statistic for 12 consecutive months, enter 12. The drop down list sets the grouping parameter in the Group function (ie GAVG, GMAX).
|
Hours |
Group Data by hours (typically used to summarize 15 minute, 1 minute,etc... date) |
"H" |
|
Partial Days |
Group data by certain hours of the day (i.e. 8AM thru 5PM). When this option is selected you will be prompted to set the Start Time and Stop Time for the grouping. |
"Hx:x" |
|
Days |
Group data by days (typically used to summarize data from hourly, 15 Minute, 1 minute, etc... data) |
"D" |
|
Months |
Group data by months |
"M" |
|
Quarters |
Group data by entire quarter |
"Q" |
|
Semi-Annuals |
Group data by Jan - June and July - Dec. |
"SA" |
|
Seasons |
Group data by Winter, Spring, Summer, Fall
|
"S" |
|
Years |
Group data by Calendar years
|
"Y" |
|
Year to End Date |
Group data from start of year through the end date of the report |
"YTD" |
|
Year to Start Date |
Group data from start of the year though one day before the start date of the report
|
"YTBSD" |
|
Moving 12 Month |
Group data by 11 months prior to the Start Date through the end of the month of the start date.
|
"MAxx" |
|
Moving N Day |
Group data by N number of days. You will be prompted for the number of days. |
"MOVx" |
|
Report Dates |
Group data from Start Date of report through the End Date of the Report. |
"R" |
|
All (1970 - Now) |
Calculate Statistic for all data (1970 through the current date) |
"A" |
Place <, >, or ND Symbol with statistic: If the variables allow entry of data qualifiers (i.e. <, >, or ND) do you want the symbol to be placed with the calculated statistic. If checked and a statistic that does not find a particular value (i.e. Max, Min, First... find a value, Avg, GeoMean, Total do not) is chosen the following options will be given:
"if one value contains a < or >"
"if all values contain a < or >"
"if half the values are < or >"
"cascade all symbols"
Decimal Places: The number of digits to show behind the decimal point. This value will default to the number of decimal places defined in the description of the variable selected. See Also: Formatting with 'Not Fixed'
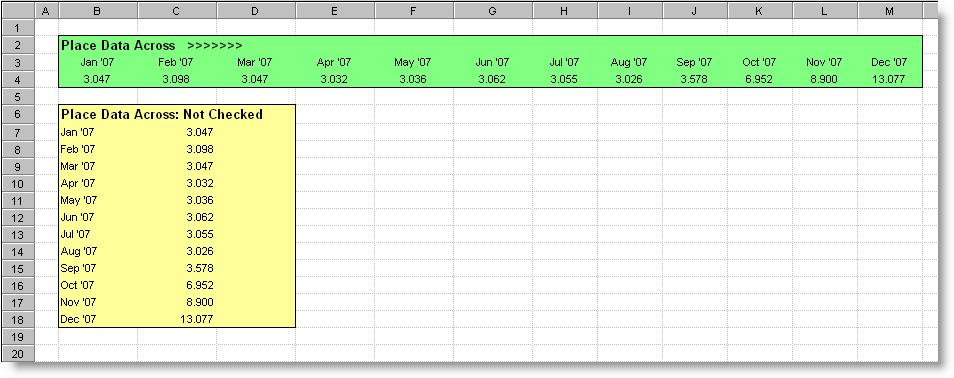
Place Data Across: When placing data into the report, locate across columns instead of down rows.

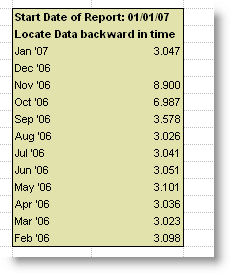
Locate data backward in time: If checked, data will be placed for previous time periods instead of next time periods. For example, if you are locating 12 monthly averages and you want the current month and the previous 11 months you would check this box.

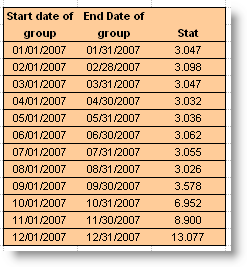
Place Start Date of Group: If checked, places the start date of each group beside the data.
Place End Date of Group: If checked, places the end date of each group beside the data.
