| Lab 2.2.1: Using the Spread Report Designer - Basics |
<Prev Next> |
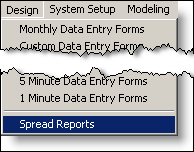
1. From the main menu select Design, Spread Reports.


Spread Report Generator allows you to use the familiar spreadsheet interface to build a report. You can locate variable data into the spreadsheet cells and use spreadsheet formulas to calculate and summarize the data.
First, let’s go over the basics of using the spreadsheet.
A spreadsheet is divided into small areas called cells. A cell is referred to by the intersection in which it lies. Notice in the Figure above the cell at the intersection of column A and row 1 (this is referred to as cell A1) is highlighted. To highlight or select a cell, simply move the mouse pointer over the cell and click one time.
The long white box near the top of the screen is called the formula bar. It displays any formula located in the selected cell. Look to the left of the formula bar, this will display the location of the selected cell (i.e. A1)
The Status Bar is located in the gray area at the bottom of the screen. The Status Bar displays information on the current cell and it's formula.
Next>