GPROP displays the probability (as a fraction) that a value will be less than or greater than a given value/limit
SYNTAX:
GPROB(VarNum, GroupOffset/StartDate,Grouping/EndDate, Limit, optional percent of limit)
VarNum: The variable number to get the probability for.
GroupOffset/StartDate: Used with the Grouping parameter to set the dates to calculate the stat for. Sets the number of Groups (set by the Grouping Parameter) to be added to set the dates. See examples below. If this field is a date string (i.e. "07/16/2004") or refers to a cell with a date in it, it is assumed to be the start date to calculate the stat for.
Grouping/EndDate: Used to set which dates to calculate the stat for. If the Grouping is a date literal string (i.e. "07/16/2004") or refers to a cell with a date in it, it is assumed to be the end date to calculate the stat for. Common Groupings are:
"D" Days
“M” Monthly
"R" Report Dates
Click here for available Grouping options
Limit: The Limit Name (or constant) to test probability for. Limits are entered for each variable using Variable Edit - Limits Tab. The common settings are:
| Name |
Description |
| DMAX |
Daily Max Limit |
| DMIN |
Daily Min Limit |
| WMax |
Weekly Max Limit |
| MMAX |
Monthly Max Limit |
| MMIN |
Monthly Min Limit |
| >x |
Compare stat to constant x, ie >30 |
| <x |
Compare stat to contant x |
| ENTRYMAX |
Compare Value to variable's Entry Max |
| ENTRYMIN |
Compare Value to variable's Entry Min |
Percent of Limit: Optional. Used to alter the Limit value to test for. Example, to test for values that are 80 percent of the DMAX limit, enter 80. Note: can be entered as a percent or fraction where all values greater than 1 is considered a percent and below 1 a fraction.
EXAMPLES:
Example 1: Calculate probability variable 4041 is greater than Daily Max Limit.
GPROB(4041,1,"R","DMAX") - returns 0.0119. This means any individual new value has a 1.19 % chance of exceeding the Daily Max Limit.
Calculation Steps:
-
Calculate the Average and Standard Deviation for variable 4041 for the report date range: Avg = 17.419 and Std Dev = 5.572.
-
Calculate the Z score where Z = (Limit - Avg) / Std Dev = (30-17.419)/5.572 = 2.26
-
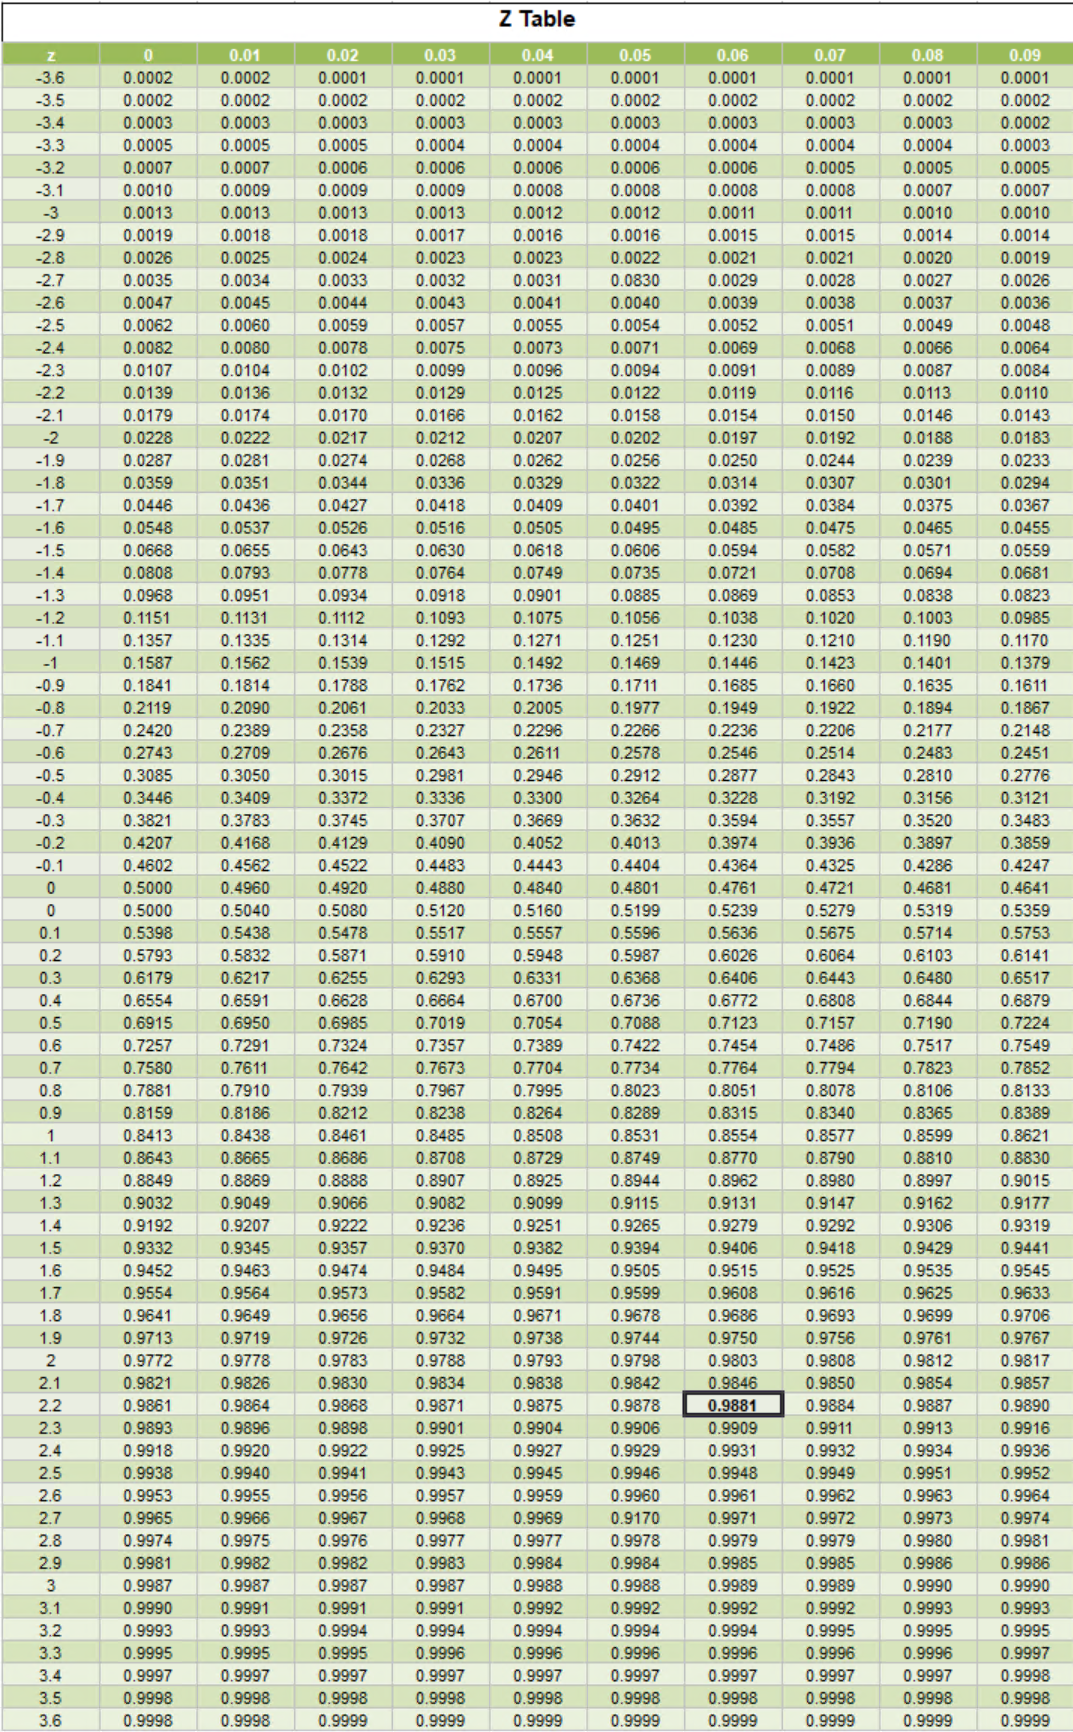
Use a probability Z Table and look up 2.2 row and the 0.06 column = 0.9881.
-
This returns the probability that the value will be less than 30 so we subtract from 1. 1 - 0.9881 = 0.0119
Example 2: Calculate probability variable 4041 is greater than 20.
GPROB(4041,1,"R",">20") - returns 0.323 (from a Z score of .46)
Example 3: Calculate probability variable 4041 is greater 80% of Daily Max Limit.
GPROB(4041,1,"R","DMAX",80) - returns 0.119
