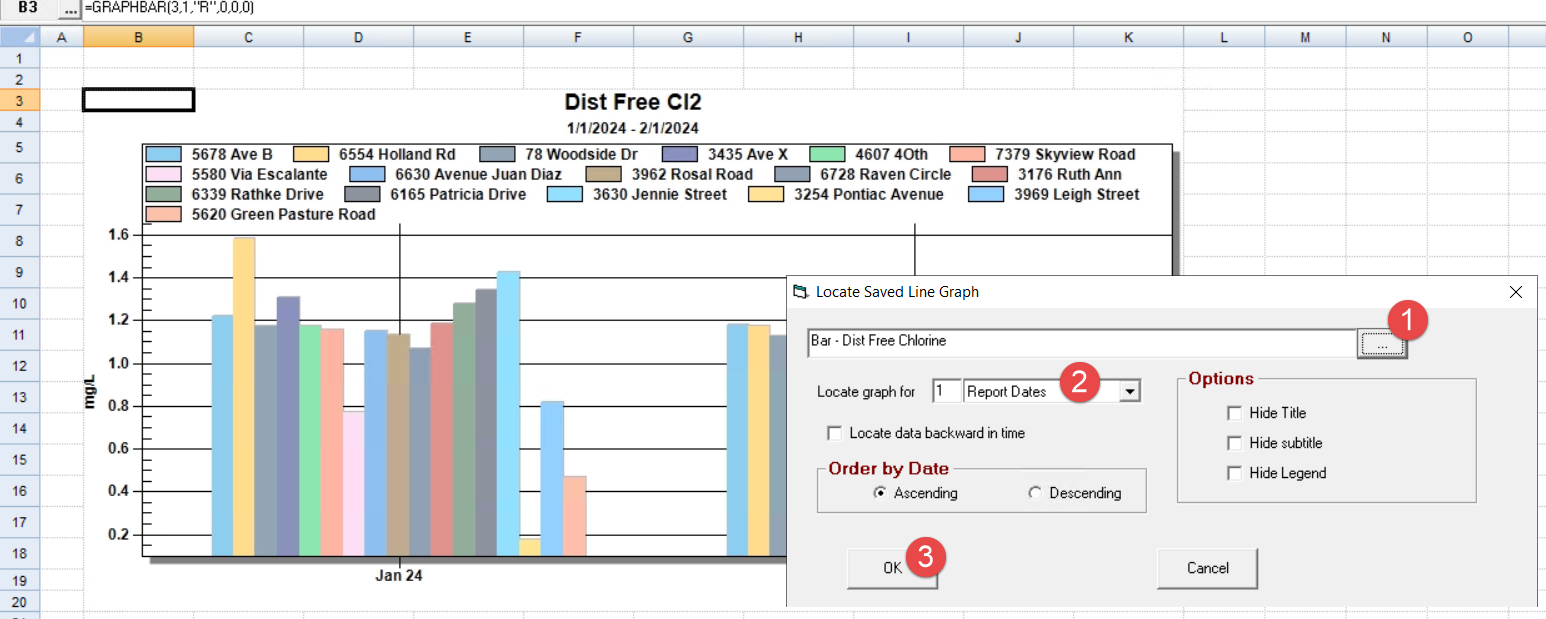
1. Use Locate, Graph, Saved BarGraph and click ... button to browse the saved Bar Graph .
2. Set the number of graphs and their grouping. In this example we are locating 3 graphs each with data for a month.
3. Click OK and the 3 graphs will be located into the report using the GraphBar function.
NOTE: It is best to size the cells to make room for the graph prior to locate. If cells are merged, the locate will place a graph and move to the next unmerged row and place the next graph.
Options:
- Hide Title - Hides the graph title (Dist Free Cl2 in example above)
- Hide SubTitle - Hides the date range below the title
- Hide Legend - Hides the graph legend at the top of graph.